24option’s Free Professional Chart – CandleChart
Novice traders can use the free CandleChart at ease
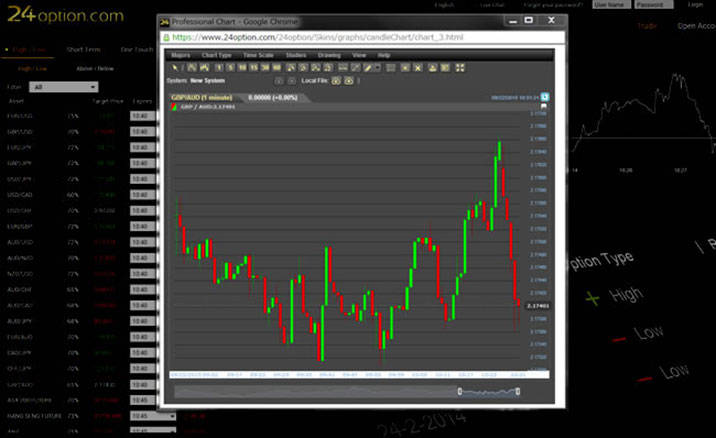
24option offers free professional charts for traders to analyze price movements. Even though the chart is free, it is fully functional and it includes candlestick chart, MA and RSI. A trader can also draw trend lines on the chart to make an analysis. Since it is easy to use, it is recommended that you use the chart.
How to use the CandleChart?
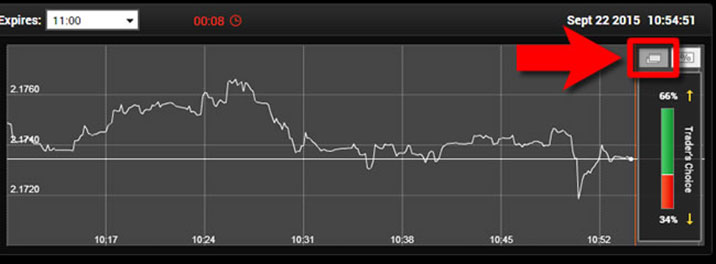
After you log into the 24option trading platform, you will see the trade box as shown above. Then, you can access to the CandleChart by clicking the button on the upper right corner of the trade box.
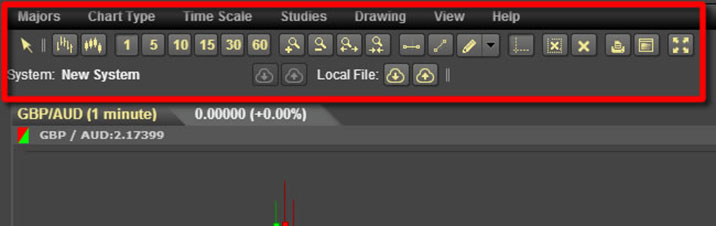
You can see the menu bar on the top of the CandleChart. You can make changes or draw trend lines by clicking on the buttons.
By clicking on the “✕” button, you can clear lines that you draw in the chart. If you want to delete selected shape/line, you can click on the circled “✕”. If you want to delete all graphic, you can click on the “✕”.
There are many binary options brokers who offer analysis tools. However, only a few of the brokers provide RSI and MACD. The 24option’s CandleChart is thus a valuable tool for analysis. A trader can use the 24option’s CandleChart to analyze the price movements so as to increase winning percentage and profits.
Since the 24option’s CandleChart is free, traders can take advantage of the chart. For novice traders, it may be difficult for them to learn all the analytical methods. At first, it would be better to learn how to read and use the RSI and candlestick charts. By learning how to use the chart to analyze the price movements and making progress, it is possible for traders to make profits in trading binary options.
The most common analytical methods using 24option’s CandleChart
Relative Strength Index (RSI)
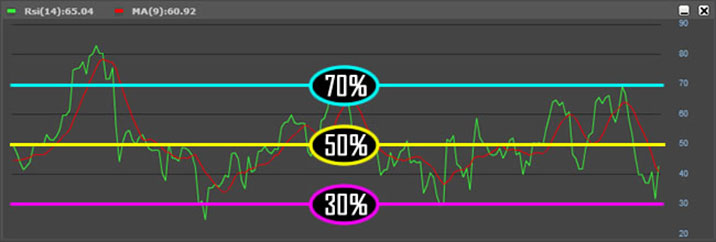
Relative Strength Index (RSI) is widely used by traders and it is a technical indicator that intends to show the overbought or oversold of an asset. The RSI ranges from 0% to 100%. The RSI number indicates whether an asset is getting overbought or oversold.
Normally, the RSI is not combined with moving average (MA). In 24option CandleChart, the RSI is shown together with the MA. There may be some traders who do not get used to the interface. However, there is no difference in how to read and interpret the RSI.
The mid-line is 50%. When the RSI is above 50%, it suggests an uptrend and a strong market. On the other hand, when the RSI is below 50%, it indicates a downtrend and a weakening market. In addition, when the RSI is above 70%, it represents an overbought condition. When the RSI is below 30%, it represents an oversold condition. It depends on the trader. Some of the traders consider that it is an overbought if the RSI stays above 80%, and it is an oversold if the RSI stays below 20%.
Bollinger Bands
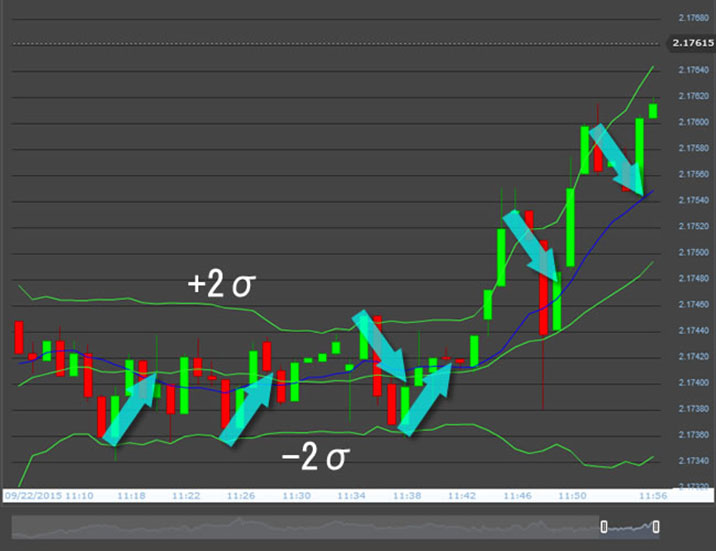
Bollinger Bands is a technical indicator that indicates price volatility and price action. It shows how many percent lies within standard deviations of the mean. It consists of ±1σ、±2σ、±3σ around a central line. A trader can make a predication on the price movements by examining how prices move within ±1σ and ±2σ. In the 24option’s CandleChart, it is ±2σ by default.
The percentage of values that lie within ±1σ、±2σ、±3σ is as follows:
In the 24option’s CandleChart, it is ±2σ by default and the percentage that lies within two standard deviations of the mean is approximately 95.5%. If it moves above the +2σ line, it indicates that it will go down. If it is below the -2σ line, it suggests that it will go up.
The 24option’s CandleChart can be used to analyze the price movements in a number of ways. Because the CandleChart is easy to use, it is recommended that novice traders use the chart and take strategies in binary options trading.
*Trading binary options involves substantial risk and may lead to loss of all invested capital. Past Performace is not a reliable indicator of future results. Trading alerts should not be considered as investment advice. The decision to act on any signals is yours and taken at your own risk.

Category:24option


New Comment